November 6, 2025

What Netflix bounce patterns reveal about streaming competition and the YouTube gateway effect.
Not all app exits are created equal. Some users jump directly to a competitor. Others drift into a different category of content that represents a different mindset and intention. Understanding app switching behavior isn't just interesting—it's essential for knowing who your real competition is.
Streaming platforms are preoccupied with finding ways to compete with YouTube, but user behavior analytics reveals a more complex competitive landscape. We’ve seen them lean into short-form content (Peacock rolled out short-form vertical video earlier this year) and hire YouTube’s biggest celebs to create content (see Amazon’s “Beast Games” with Mr. Beast). And most recently, there’s Netflix’s deal with Spotify to air some video podcasts--which, importantly, would prohibit them from airing in entirety on YouTube.
Our data supports the competitive threat. Looking just at Netflix and YouTube, 9 in 10 Netflix users also use YouTube, while just 3 in 10 YouTube users also use Netflix. But beyond this broad user overlap, we investigated app journeys and quick-switch patterns to understand how different entertainment platforms serve different moments and mindsets—and what this reveals about the nature of streaming competition. This asymmetry matters. YouTube is not just another entertainment app; it operates as a utility layer, closer to email or messaging than to a traditional streaming service. Users don’t open YouTube for a specific show or time commitment. They default to it across moments, durations, and use cases.
That helps explain the low reverse overlap and why attention rarely flows back to streaming once users leave. It also explains recent platform behavior. Netflix’s reported video-podcast deal with Spotify and Spotify’s long-standing limits on full YouTube distribution are attempts to slow YouTube’s utility dominance, not outcompete it as a peer streamer.
We analyzed platform switching patterns by tracking “bounces”—when users spend 10 minutes or less on Netflix before switching to another media app (specifically tracking transitions between Netflix and five major platforms: YouTube, Amazon Prime, Disney+, Instagram Reels, and Facebook Reels). These quick exits reveal where users go when they're not finding what they want, or when Netflix loses out in the battle for attention.
The clear winner? YouTube.
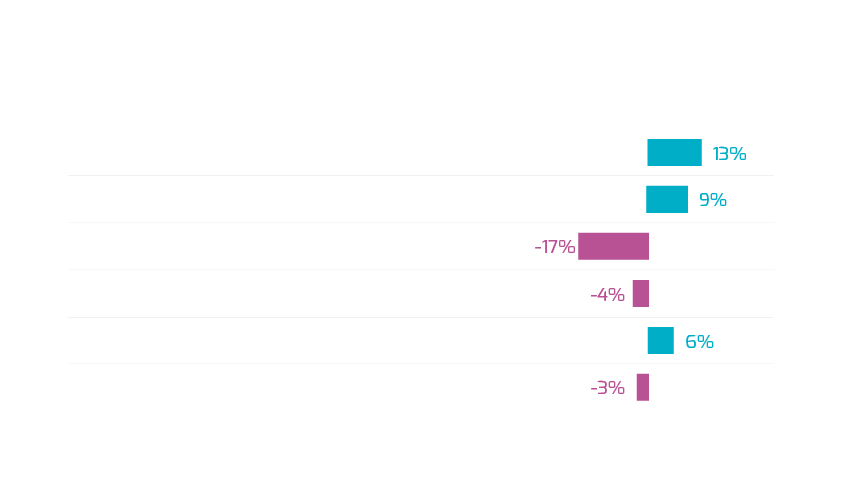
Among bounces that go to one of these five platforms:
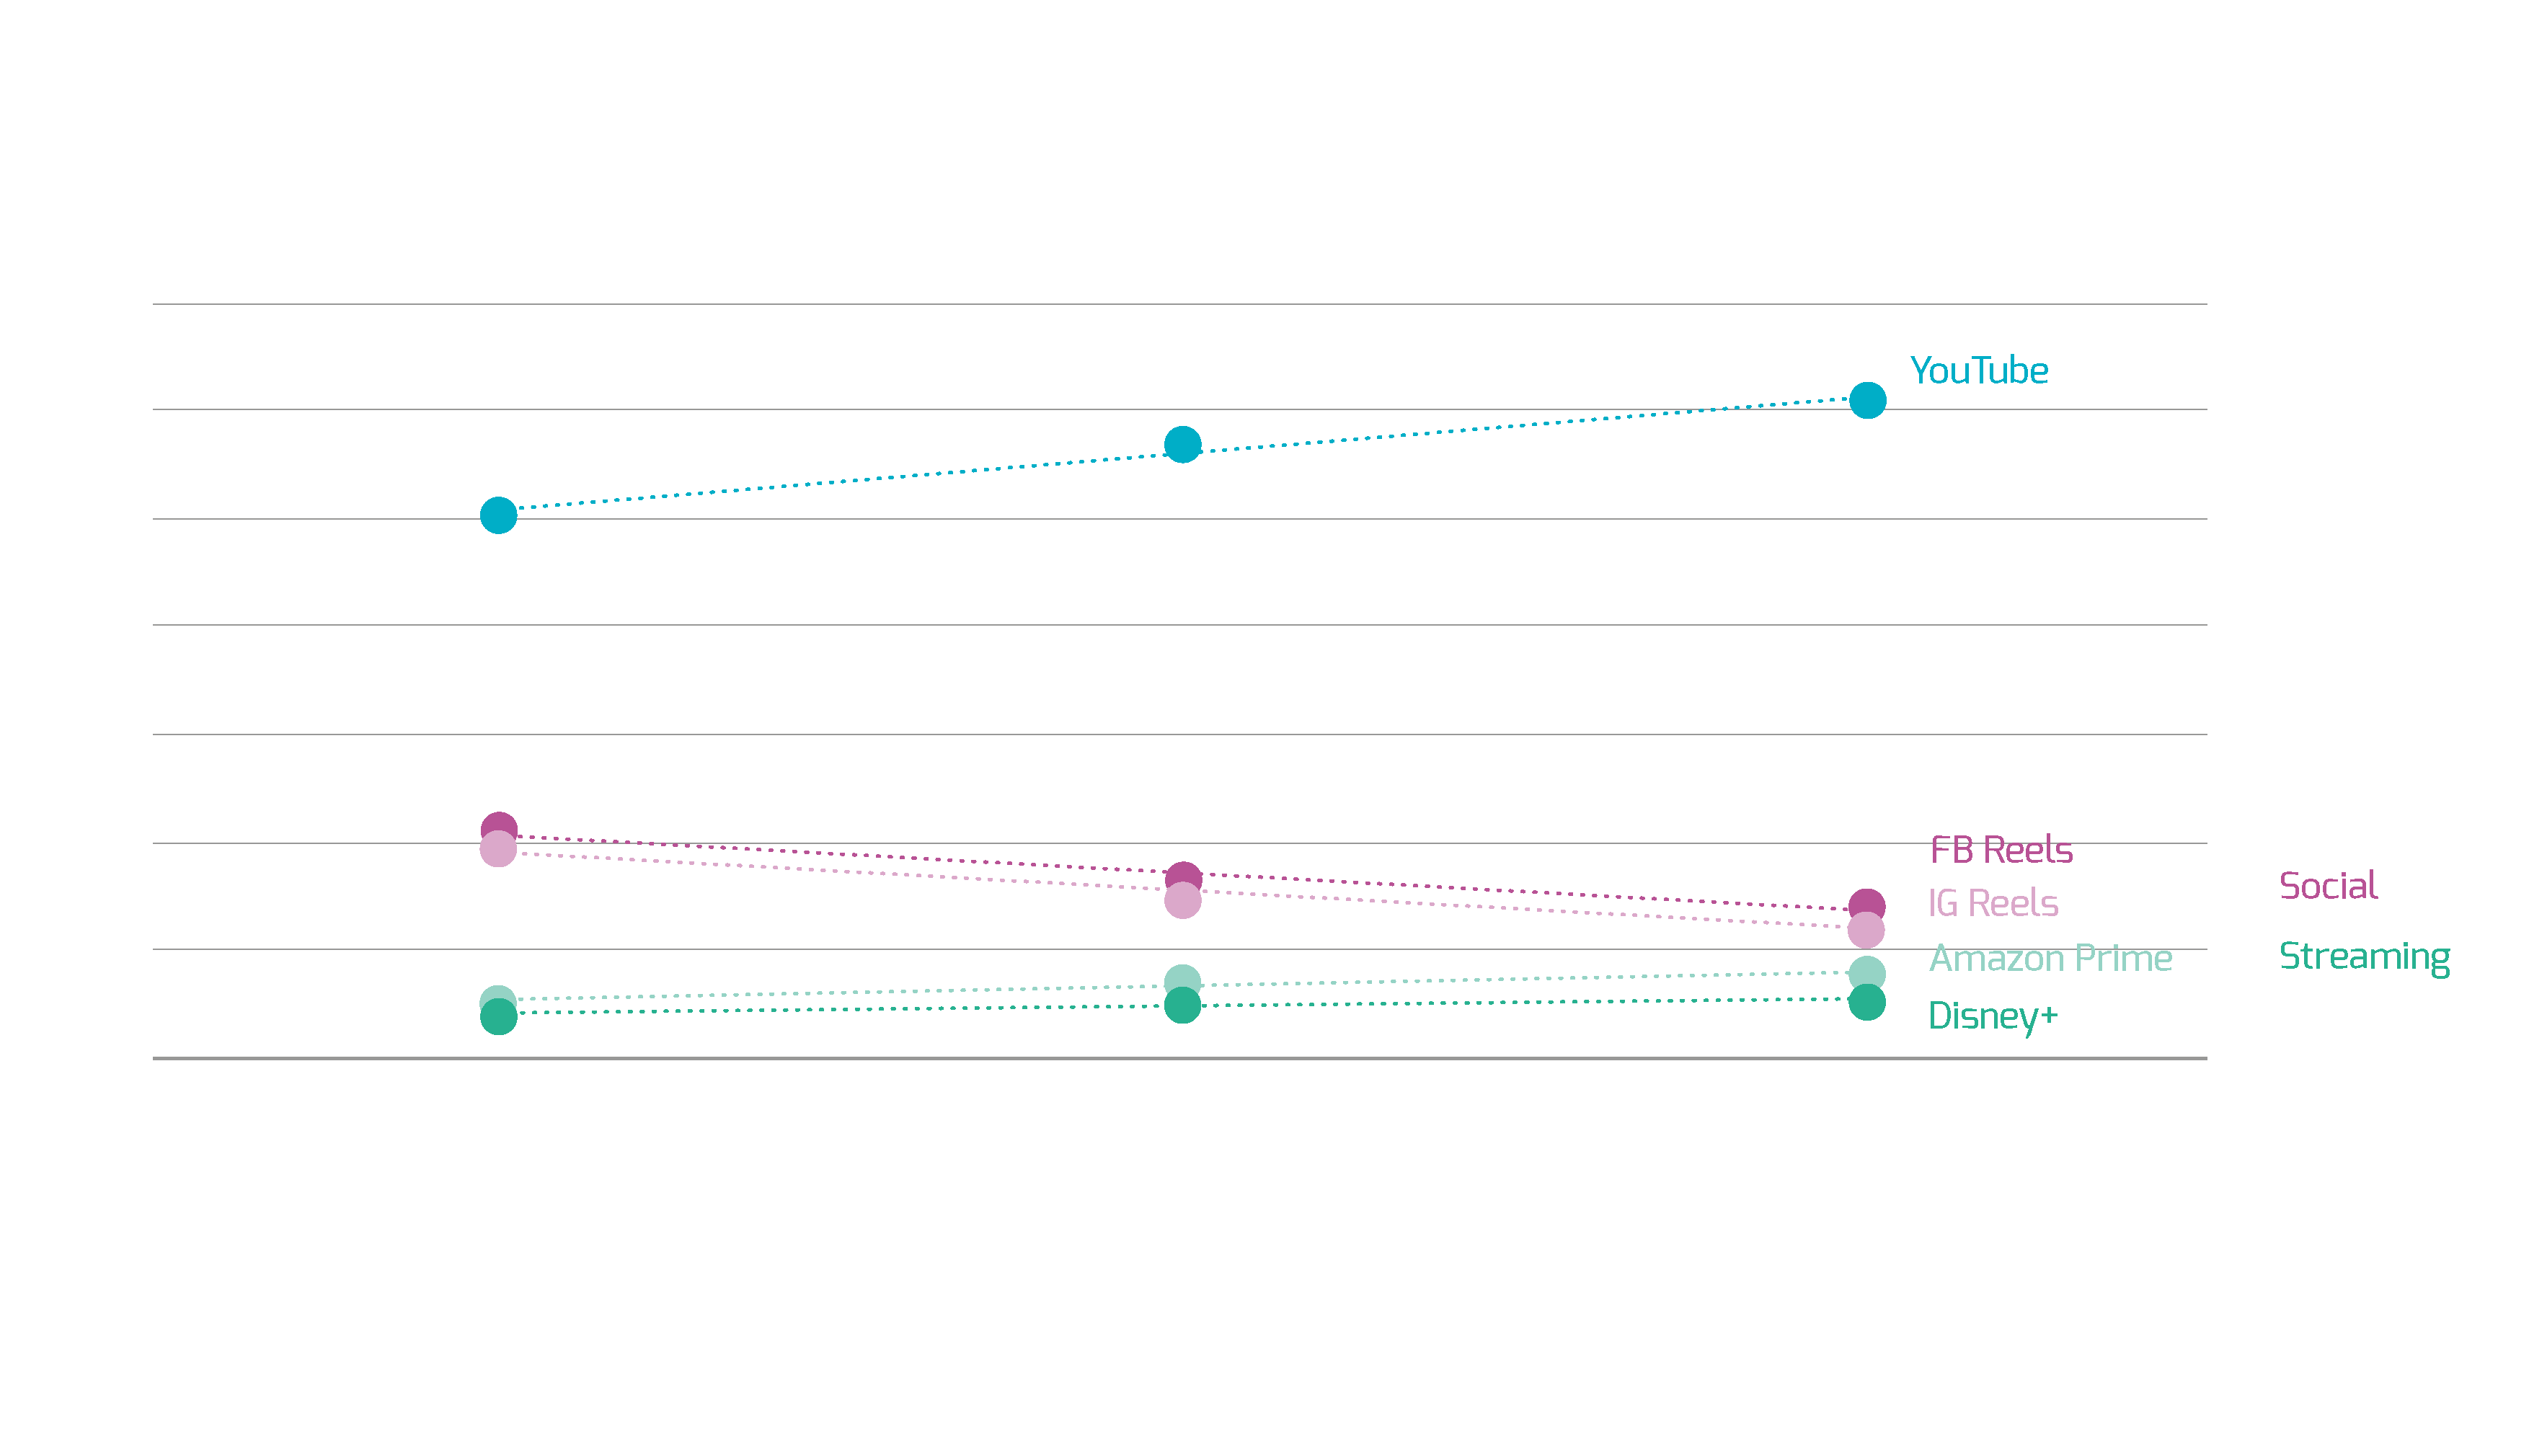
Fast switching signals active substitution. These users still want to watch a video, but Netflix did not surface the right content quickly enough. This is most visible in the fastest exits, where 61% of users who bounce within five minutes go directly to YouTube, indicating an immediate replacement rather than a shift to passive scrolling.
YouTube is especially dominant for quick switches, suggesting active substitution rather than habitual scrolling. The quicker users switch, the more likely they are to go to YouTube and other streaming platforms (Amazon Prime, Disney+), while social media (Instagram and Facebook Reels) picks up a larger share of the slower switches. When Netflix doesn’t deliver, users seek out immediate alternatives to find something to watch.
Once on YouTube, these former Netflix viewers are more likely to gravitate toward entertainment and film. This is more evidence these users are staying in “content consumption mode.”
But YouTube is more than just a streaming alternative: it’s an inflection point in the user attention journey, revealing critical competitive intelligence about where audiences actually flow.
YouTube sits between long-form streaming and short-form social video. It offers more choice and flexibility than Netflix, but requires more intent than infinite-scroll formats like Reels.
When we look at the same bounce patterns for YouTube, the pattern reverses: within our media ecosystem, over half go to Instagram Reels (57%) and a third to Facebook Reels, while just 1 in 10 return to streaming platforms like Netflix or Amazon Prime. Once users move through YouTube, very few return to streaming platforms, reinforcing its role as a transition point rather than a destination with strong return pull. Once users move through YouTube, very few return to streaming platforms, reinforcing its role as a transition point rather than a destination with strong return pull.
What this means: YouTube acts as a gateway from long-form to short-form content. Users move easily from Netflix → YouTube → Reels, but infrequently reverse back to focused streaming. Once users slide down this attention chain toward lower-friction content, it becomes difficult to pull them back “up” into high-commitment viewing experiences.
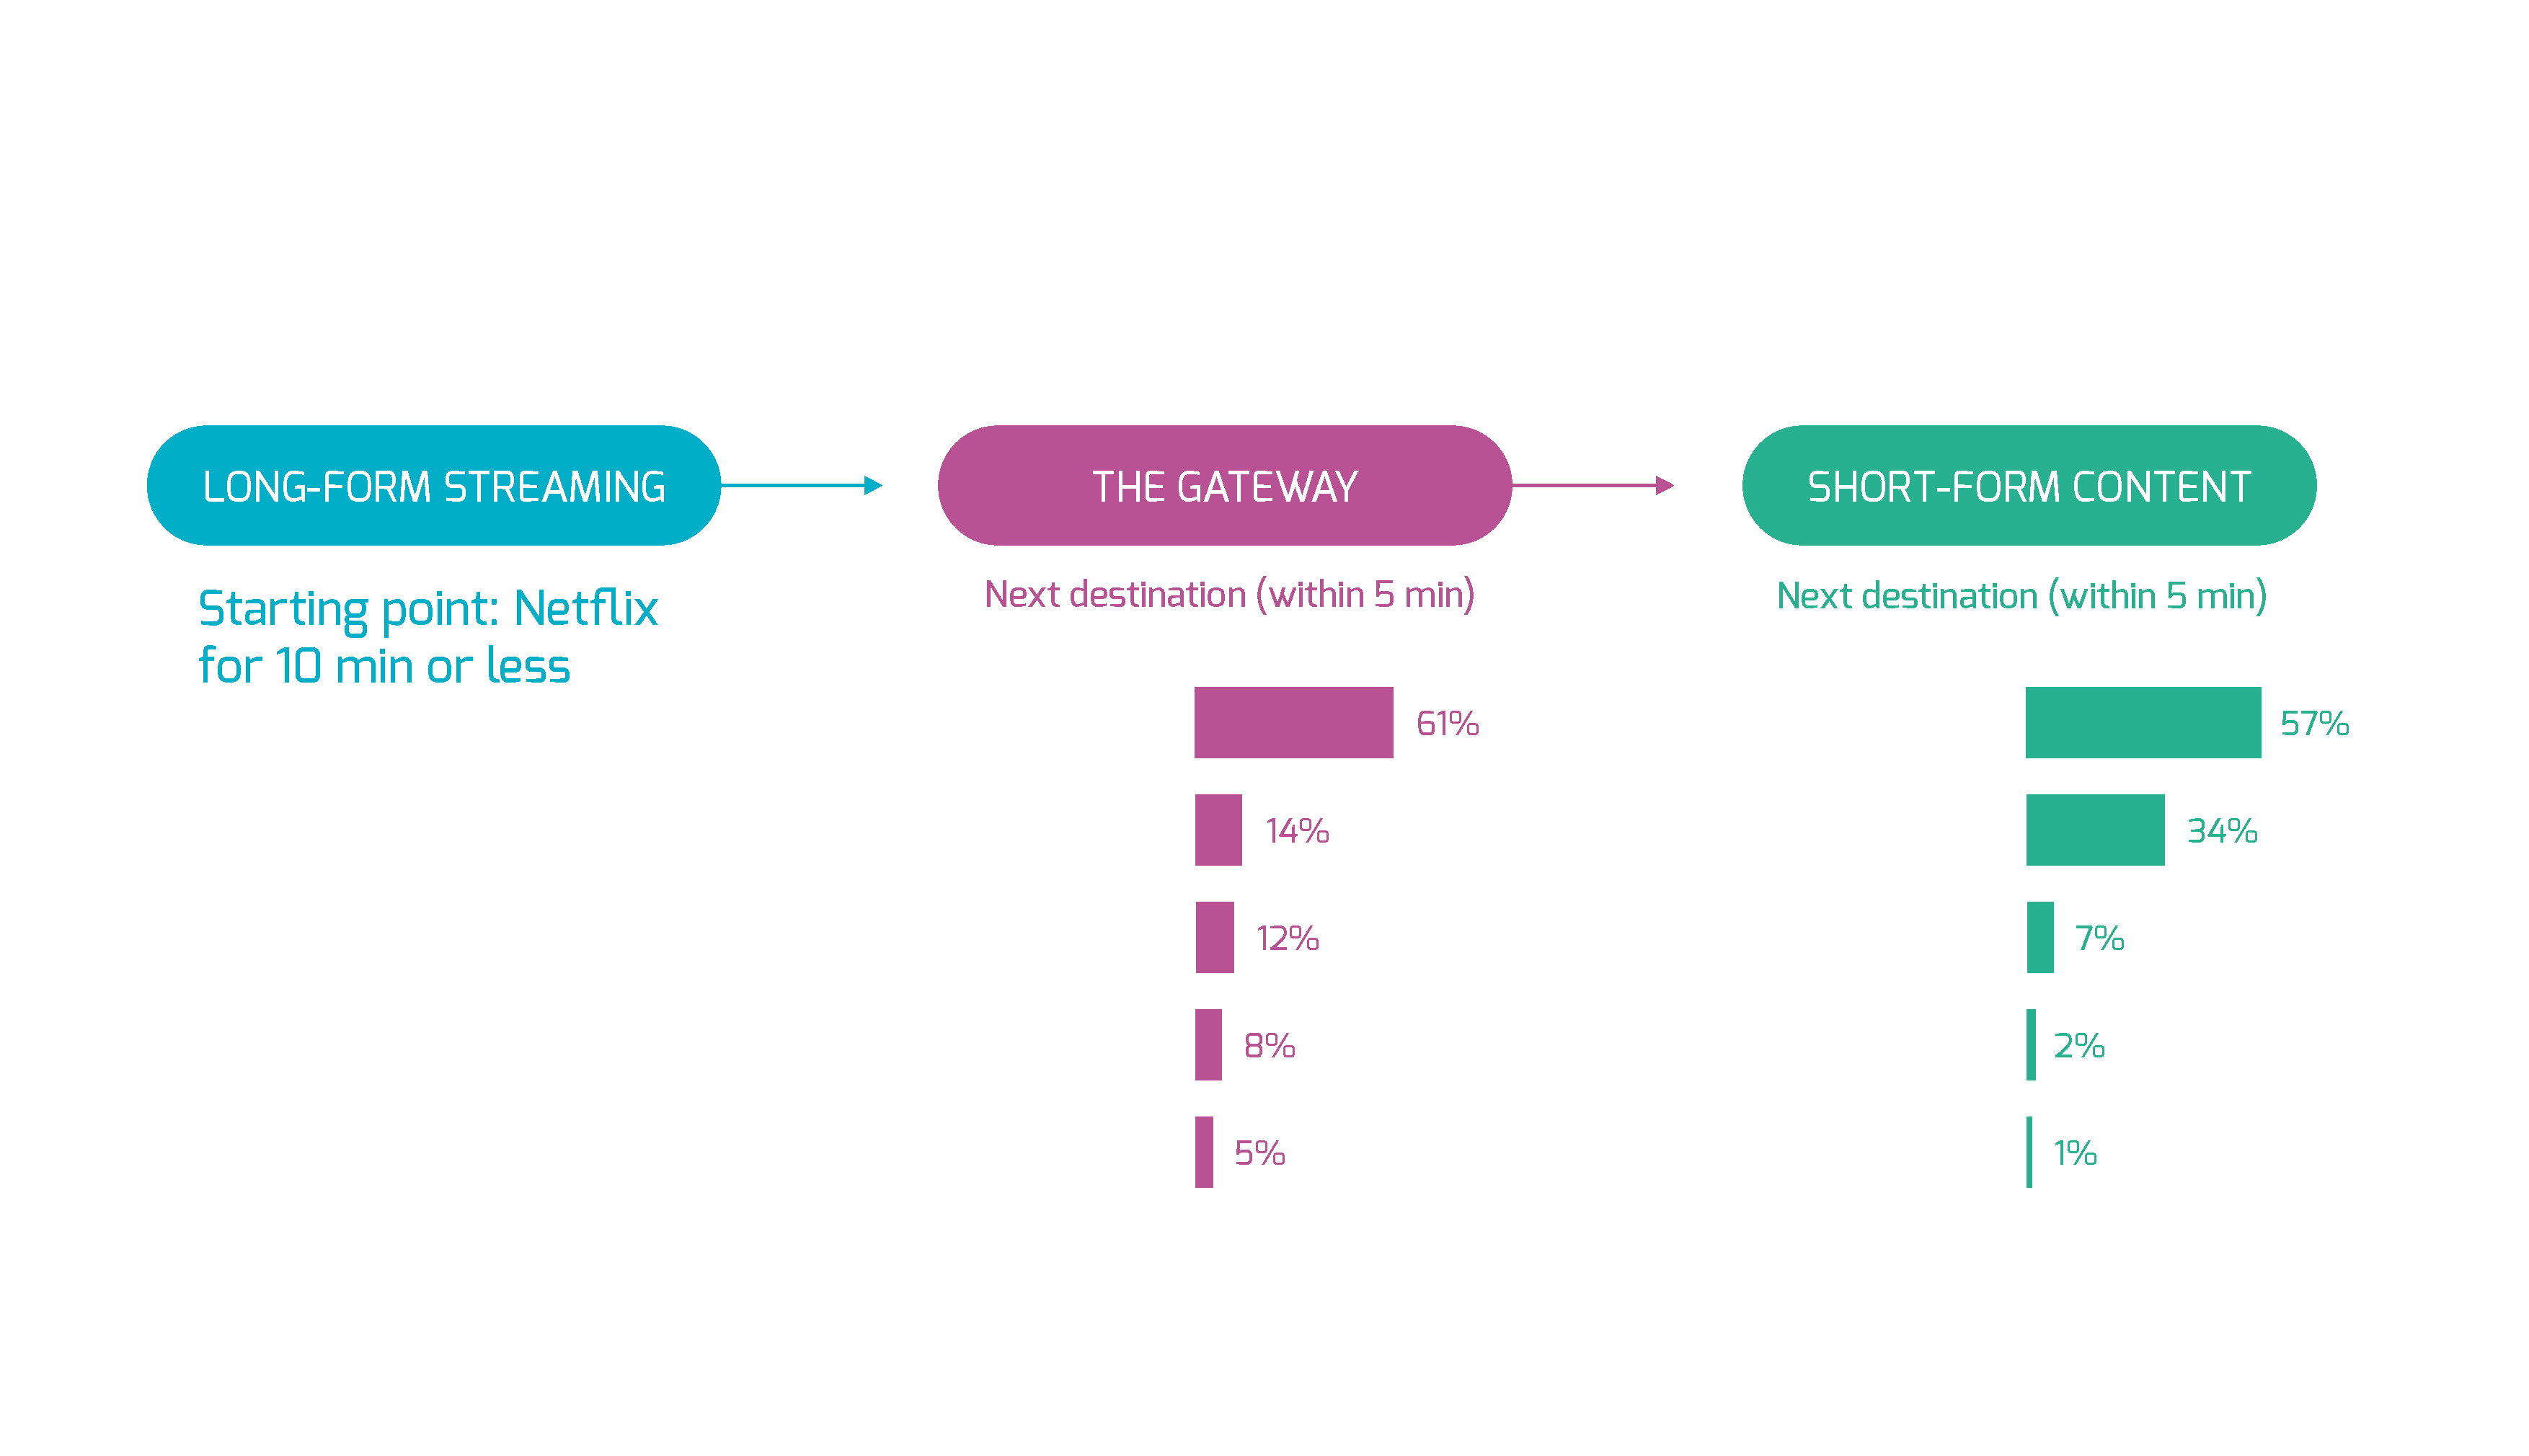
Once users slide down this attention chain toward lower-friction content, it becomes difficult to pull them back “up” into high-commitment viewing experiences.
Each platform represents a different behavioral state, and understanding these modes explains why the attention cascade flows in one direction:
The brain naturally seeks the fastest path to reward. Short-form formats deliver immediate visual or narrative payoff, often every 10–15 seconds. Once users enter this instant-feedback loop, it becomes chemically and cognitively harder to return to high-commitment platforms like Netflix, where rewards are delayed and require sustained attention.
Traditional competitive intelligence focuses on direct substitutes: other streamers for Netflix, other social platforms for Instagram. But the attention cascade reveals a different competitive dynamic: platforms that pull users into entirely different behavioral modes.
Tracking app switching behavior and understanding which platforms make it harder for users to return is competitive intelligence that doesn't show up in market share reports.
Want to understand your competitive landscape beyond traditional market share? RealityMine's behavioral data reveals where your users really go—and why they don't come back.
Yes. App switching behavior is highly predictive when analyzed over time. Historical patterns like session length, prior bounce destinations, time of day, and content category consumption can signal when a user is likely to quick-switch. While individual actions vary, aggregate behavior reliably shows when users are in a high-risk state for abandoning one platform in favor of another.
Yes, but behavior matters more than age or gender alone. Users who frequently engage with short-form video, multitask across devices, or consume content in short time windows are more prone to quick switching. These traits often correlate with younger audiences, but they increasingly cut across all demographics as short-form habits become mainstream.
Multitasking increases switching frequency and reduces tolerance for friction. Users who watch video while messaging, working, or browsing are less likely to commit to long-form content and more likely to abandon an app if content discovery is slow. In these moments, platforms that offer immediate payoff win attention, even if they were not the original destination.
In media-heavy sessions, users often move through two to four apps before settling or dropping into passive scrolling. Short sessions tend to involve direct substitution, such as Netflix to YouTube, while longer sessions show cascading behavior, moving from streaming to browse-heavy platforms and eventually to short-form social video.
Quick switches indicate a mismatch between user intent and what the app surfaced. The user still wants the same outcome, usually to watch something, but the platform failed to deliver the right content fast enough. High rates of rapid exits often point to discovery friction, weak recommendations, or poor alignment between the entry moment and the content offered.